
Views: 0 Author: Site Editor Publish Time: 2026-10-18 Origin: Site


Ever stared at a confusing technical schematic while standing in a muddy field? Or perhaps you were in a noisy mechanical room trying to figure out how to align your PVC pipes. Misinterpreting how water and debris move through a fluid system is a fast track to disaster. You risk improper installation. You experience severe pressure drops. Your emitters become permanently clogged.
To prevent these costly errors, you must visualize the process. Centrifugal force actively separates heavy particles from water. It achieves this entirely without physical mesh or moving parts. In this comprehensive guide, you will learn how to decode a technical drawing. Understand the specific flow dynamics and sediment discharge mechanisms illustrated on paper. Ensure your equipment is installed correctly and optimized for long-term performance.
At its core, a diagram for a centrifugal filter is a cross-sectional blueprint provided by equipment manufacturers. Its primary purpose is to display the internal geometry, dimensional specifications, and exact fluid flow paths of the filtration unit. Basic product photos only show a painted metal exterior. In contrast, these engineering drawings reveal the hidden mechanics of how separation actually occurs.
They feature standardized symbols for valves, pressure gauges, and directional flow arrows. Field installers and engineers use these schematics to understand precise operational parameters before integrating the equipment into a larger pressurized network.
This equipment serves a highly specific physical function in agricultural and industrial water systems. It acts as a primary irrigation pre-filter designed to remove heavy inorganic solids from the raw water source. Target debris includes sand, silt, gravel, and pipe scale. Imagine pulling a ruined, sand-scored impeller out of a costly pump. That exact nightmare is what this pre-filtration stage is designed to prevent.
The unit forces water into a high-speed spin. It isolates destructive particles before the water reaches finer secondary systems like screen or disc filters. Consequently, this protects expensive infrastructure from premature failure. Micro-drip emitters and automated solenoid valves remain safe and functional.
Accurately interpreting these schematics is a fundamental step in the procurement and installation process. Buyers must consult the drawing to verify port sizes, flange standards, overall footprint dimensions, and spatial orientation. This ensures the unit actually fits the designated concrete pad or pump house.
Misreading the diagram often leads to critical installation errors. For instance, installing the unit backward entirely defeats the physics of the separation process. It pushes raw sand directly into delicate irrigation lines. A thorough understanding of the schematic ensures that the purchased equipment aligns with the hydraulic limits of the system. You prevent voided warranties and operational headaches.
To properly interpret the blueprint, you must first recognize the standard components depicted in the drawing. The breakdown below outlines the primary parts, how they appear on a schematic, and their physical function in the real world.
| Component Name | Diagram Representation | Physical Function |
|---|---|---|
| Tangential Inlet | A pipe entering the side of the upper cylinder off-center. | Introduces fluid at a specific angle to initiate the rotational vortex. |
| Conical Body | An inverted triangle or tapering cone shape in the middle section. | Accelerates the rotational velocity of the fluid as the internal diameter decreases. |
| Top Outlet | A vertical pipe extending downward into the center, exiting the top. | Captures the low-pressure clean water from the inner vortex and directs it downstream. |
| Sediment Chamber | A separate tank or elongated tube at the very bottom of the cone. | Collects separated heavy particles and isolates them from the active turbulent flow. |
| Baffle Plate | A horizontal line or slotted barrier above the collection chamber. | Prevents turbulent water from sucking settled debris back into the clean fluid stream. |
On a standard schematic, you will rarely see the inlet pointing straight at the center of the filter body. The drawing shows the inlet pipe intersecting the side of the upper cylinder off-center. This tangential entry is the fundamental catalyst for the entire system. Pressurized water enters through this offset port and violently strikes the curved interior wall. This impact instantly converts linear velocity into angular velocity. The high-speed spin begins.
The most prominent feature of the diagram is the inverted cone shape. Engineers call this the cyclone zone. As water travels downward from the cylindrical top section into this tapering cone, the physical space restricts. According to the strict laws of fluid dynamics, decreasing the rotation radius forces the fluid speed to increase. This conserves angular momentum. The schematic highlights this zone to show exactly where the centrifugal force reaches its absolute maximum intensity. Heavy debris is thrown outward against the walls.
Engineers carefully scrutinize the top outlet. In the drawing, this is a pipe that protrudes straight down into the center of the upper cylinder. It stops just above the conical section. The exact center of the spinning vortex contains the cleanest water and the lowest pressure. Therefore, this centrally located pipe acts as an escape route. The diagram clearly dictates that water must reverse its downward trajectory. It travels upward through this specific pipe to exit the system.
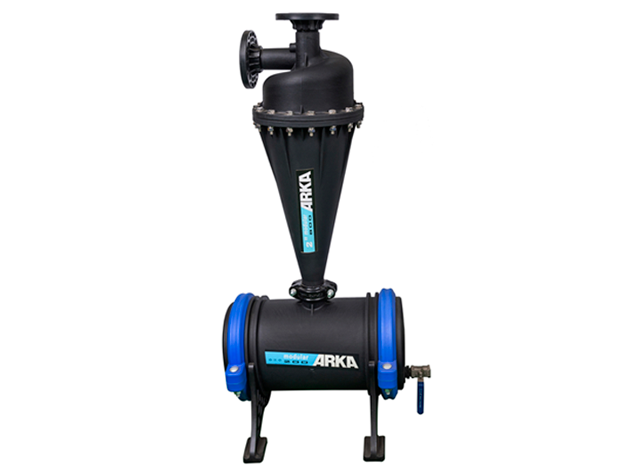
Understanding the intricate dance of the directional arrows is essential for grasping internal fluid dynamics. A sand separator does not clean water by pushing it through a physical restrictive barrier. Rather, it separates materials entirely based on density and mass.
Trace the inlet arrows on the blueprint. You are following the path of raw unfiltered water. The fluid enters at high velocity. It hugs the outer perimeter of the filter body in a downward-spiraling motion. This outer spiral generates immense centrifugal force. That force acts upon every single particle suspended in the fluid matrix.
The outer spiral travels down the narrowing cone until it hits a constraint near the bottom sediment chamber. At this precise junction, fluid dynamics shift dramatically. The water cannot easily enter the already-pressurized isolated sediment tank. It is forced to reverse its vertical direction. A secondary extremely tight inner vortex forms. It spins rapidly upward through the exact center of the outer vortex. Heavy debris has already been pushed to the outer walls. Consequently, this inner upward spiral consists entirely of clean water.
The ultimate goal of analyzing the schematic is to understand how the system manages abrasive waste. Physical separation of particles is highly dependent on specific gravity. The drawing shows exactly where this waste ends up.
Sand, scale, and metal shavings have a higher specific gravity than water. The centrifugal force generated in the cyclone zone affects them differently. The force throws these heavy particles outward. They break free from the inner water flow and press hard against the abrasive-resistant outer walls of the cone. Once pinned against the wall, the rotational velocity of the particles slows slightly due to friction. Gravity takes over from there. It pulls this heavy sliding layer of debris down the steep walls of the cone. The debris slips past the internal baffle plate and lands safely into the collection chamber.
The bottom-most section of the diagram illustrates the discharge mechanics. You will typically see a manual ball valve or an automated solenoid valve attached to the base of the sediment filter tank. The schematic demonstrates that this chamber is hydraulically isolated from the main vortex. Opening the purge valve will not disrupt the primary filtration process. Operators can flush out accumulated sand and gravel while the irrigation or industrial system remains fully pressurized. This is a massive advantage for continuous-flow operations.
A beautifully drawn diagram is useless if it lacks accurate operational data. Proper sizing is the single most critical factor in the success or failure of a centrifugal filtration system.
Dimensional callouts on the drawing indicate the size of the inlet and outlet ports. You might see 2-inch, 3-inch, or 4-inch flanged connections. A widespread engineering mistake is assuming your filter size should simply match your existing pipe diameter. The pipe size on the diagram must be matched to your system's actual volumetric flow rate measured in cubic meters per hour or GPM.
Consider a 3-inch nylon lightweight model designed for agricultural irrigation. It requires a specific flow velocity to maintain its debris-separating cyclone. If your system runs at a flow rate designed for a 2-inch unit, installing a 3-inch model just to match a mainline will result in sluggish water entry. Zero vortex formation follows. Total system failure is the final result. Always consult performance curves to find the minimum and maximum flow velocity required for that specific geometric model.
Traditional paper schematics remain the foundation of system design. However, the fluid management industry is rapidly evolving toward data-driven digitized filtration models. Modern engineering increasingly relies on Computational Fluid Dynamics software. Engineers use this technology to simulate the exact vortex behaviors depicted in standard diagrams. It allows for hyper-optimized conical geometries that maximize separation efficiency while minimizing pressure loss.
Furthermore, system integrators now outfit traditional mechanical filters with smart IoT pressure sensors. Operators monitor real-time pressure drops across the inlet and outlet ports from remote dashboards. They can instantly validate whether the physical unit is performing according to the theoretical curve shown on the diagram. Understanding a basic centrifugal schematic is no longer just about physical installation. It is the absolute prerequisite for diagnosing digital alerts and maintaining automated high-efficiency networks.
Selecting the correct unit requires matching the empirical data on the schematic to the harsh environmental realities of your specific water source.
You must understand the structural limitations shown by the physics of the diagram. The separation process relies entirely on fluid dynamics. Therefore, a hydrocyclone filter is engineered strictly for heavy inorganic matter. Sand has a specific gravity of approximately 2.65. It is easily thrown to the outer walls.
Organic matter like algae, leaves, or biological slime has a specific gravity very close to water. These lighter particles will simply remain suspended in the inner upward vortex and exit through the top outlet. The diagram implies its role as a pre-filter. It handles the heavy abrasives but must be paired with a secondary screen or disc filter downstream to capture lightweight organic materials.
Carefully review the diagram's legend for material specifications and maximum allowable working pressure. Agricultural setups often utilize lightweight nylon materials for excellent fertigation resistance and ease of installation. Industrial cooling towers and heavy-duty well systems demand robust metals. Look for industrial-grade options built from carbon steel with specialized baked-on epoxy coatings. High-velocity sand scraping against the inner walls acts like sandpaper. Without a durable material or coating, the internal geometry depicted in the diagram would quickly wear away.
A technical diagram is far more than just a supplementary drawing. It is a vital map of fluid dynamics that ensures efficient water purification. By showing exactly how kinetic energy is applied to water and how sediment is discharged, the schematic serves as your ultimate reference point. Always consult the manufacturer's blueprint before any installation. Guarantee optimal sizing, prevent pressure loss, and protect your downstream infrastructure. Taking the time to translate those lines and arrows into real-world plumbing will secure your system's long-term performance.
Ready to upgrade your system's filtration efficiency? Explore high-performance solutions tailored to your exact flow requirements. From lightweight 3-inch nylon models for agriculture to heavy-duty carbon steel desanders for industrial applications, choosing the right equipment makes all the difference. Visit Arka Irrigation to find the perfect centrifugal filter for your project today.
Locate the specific directional arrows provided by the manufacturer. The inlet arrows point tangentially off-center into the side of the cylinder to initiate the spin. Inside the main body, arrows depict an outer downward spiral representing raw water. At the base of the cone, the arrows reverse direction. They show an inner tighter upward spiral that leads directly out the top center outlet. This indicates the path of the clean fluid.
A centrifugal separator utilizes fluid dynamics and specific gravity to throw heavy particles out of the water stream. It contains no moving parts or physical barriers. It cannot clog and requires zero maintenance other than purging the collection tank. A standard sediment filter relies on a physical barrier like a mesh screen or paper cartridge to trap particles. Physical filters quickly clog when exposed to heavy sand loads. This results in severe pressure drops.
Sand bypass usually occurs due to improper flow rates. If the water velocity entering the tangential inlet is too low, the system fails to generate a strong enough vortex. Without sufficient centrifugal force, heavy sand particles are not pushed to the outer walls and simply travel up the center outlet with the clean water. Verify your system's actual flow rate against the manufacturer's performance curve to ensure you are operating within the required velocity range.
Centrifugal systems require target particles to have a specific gravity significantly heavier than water. Water has a specific gravity of 1.0. Effective separation typically requires particles to have a specific gravity of 1.5 or higher. Sand, gravel, and metal scale fall well above this threshold. Lightweight organic matter like algae or fine clay has a specific gravity too close to water and will not separate efficiently.
Flow rate is the single most critical operational variable. If the flow rate is too low, the water lacks the kinetic energy required to create a high-velocity vortex. Heavy particles will not be pushed to the outer walls. If the flow rate is too high, it creates excessive friction and an unacceptably high pressure drop across the system. This wastes pumping energy and accelerates internal wear. You must match your system's output to the optimal operating range provided by the manufacturer.


